Project Charter
Research & Planning Framework
Digital twin methodology, data sources, and modeling assumptions for step load interconnection.
Executive Summary
Project Purpose
Provide a practical, planning-grade sandbox to evaluate where large new loads (e.g., data centres, EV charging stations, etc.) can be connected with acceptable reliability risk, available headroom, and transparent engineering assumptions.
⚡ The Grid Balancing Act
At its core, the power grid is a massive, real-time machine where supply must perfectly match demand every second. If this balance shifts, the grid loses stability and reliability.
📈 The Electrification Era
The rapid expansion of AI Data Centres and the mass adoption of Electric Vehicles (EVs) are driving an unprecedented surge in demand. This transition requires a level of grid planning that is more dynamic than ever before.
🎮 Digital Twin Sandbox
This app acts as a flight simulator for the Ontario Power Grid:
- Visualize the power journey from Generators to Demand Centres.
- Simulate step loads to see where thermal capacity thresholds are hit.
- Run Monte Carlo simulations to calculate probability of headroom breaches.
Technical Pipeline
Project Methodology
1. Data Ingestion & Synthesis
Supply-Side Ingestion
Automated parsing of IESO Market Data (Nuclear, Hydro, Wind, Gas) and CER Energy Future 2026 scenarios.
Demand-Side Synthesis
Mapping hyperscale project pipelines (Baxtel/National Observer) against regional peak demand forecasts.
2. Probabilistic Reliability Modeling
Stochastic Sampling
Load profiles are modeled using Triangular Distributions (Min, Mode, Max) to account for operational variance.
Convergence
10,000+ iterations are run to determine the probability of "Headroom Breach" at key substations.
3. Climate-Adjusted Efficiency Analysis
IESO July 2025 Calibration
Applying the 44% peak cooling overhead identified in the "Large Step Loads" technical paper.
Dynamic PUE Mapping
Cooling efficiency factors are adjusted based on ambient temperature data from the Open-Meteo API.
4. Spatial Analytics & Visualization
Multi-Tier Mapping
Leveraging high-performance mapping interfaces for high-fidelity visualization of supply/demand proximity.
Regional Hierarchies
Data is classified into Transmission (Red), Regional (Orange), and Demand Centres (Green) to identify bottlenecks.
5. Verification & Validation
Benchmark Comparison
Simulation outputs are cross-referenced against the IESO 2026 Annual Planning Outlook (APO).
Engineering Logic
Adheres to ASHRAE TC 9.9 thermal classes and Ontario Energy Board (OEB) load capacity frameworks.
Infrastructure Schematics
Smart Grid & Energy Distribution
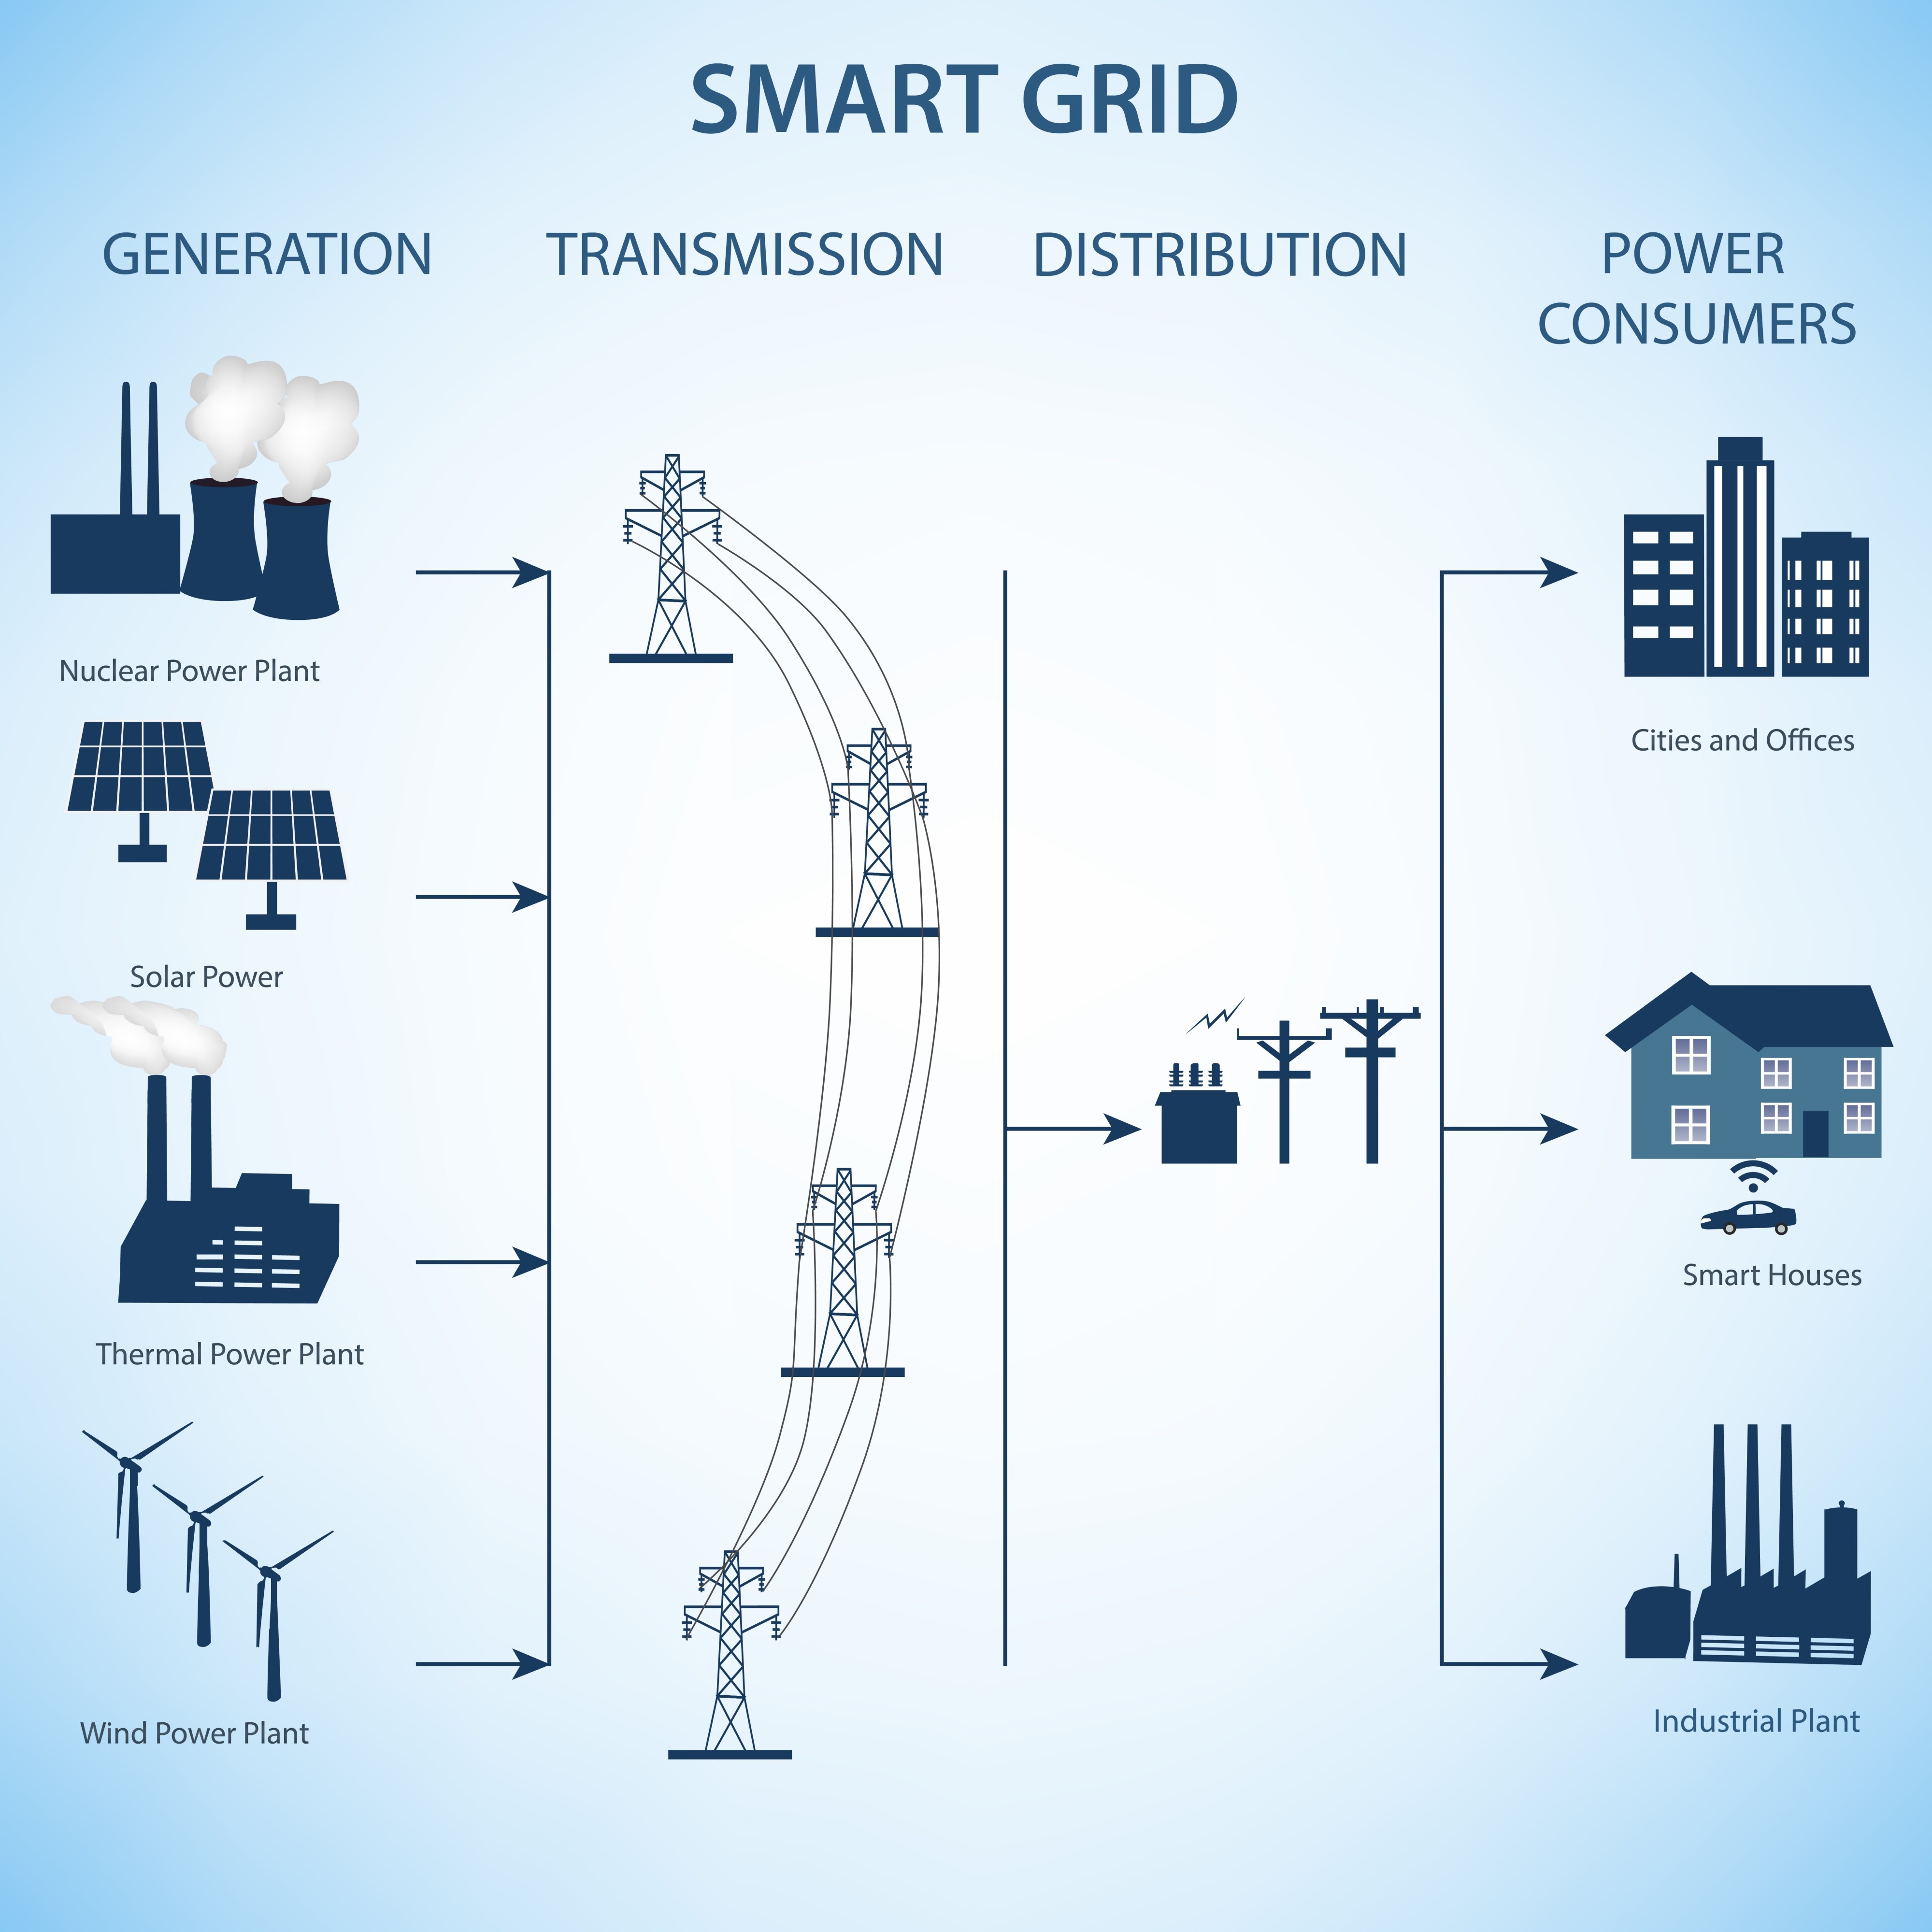
Figure 1 - Smart Grid Overview
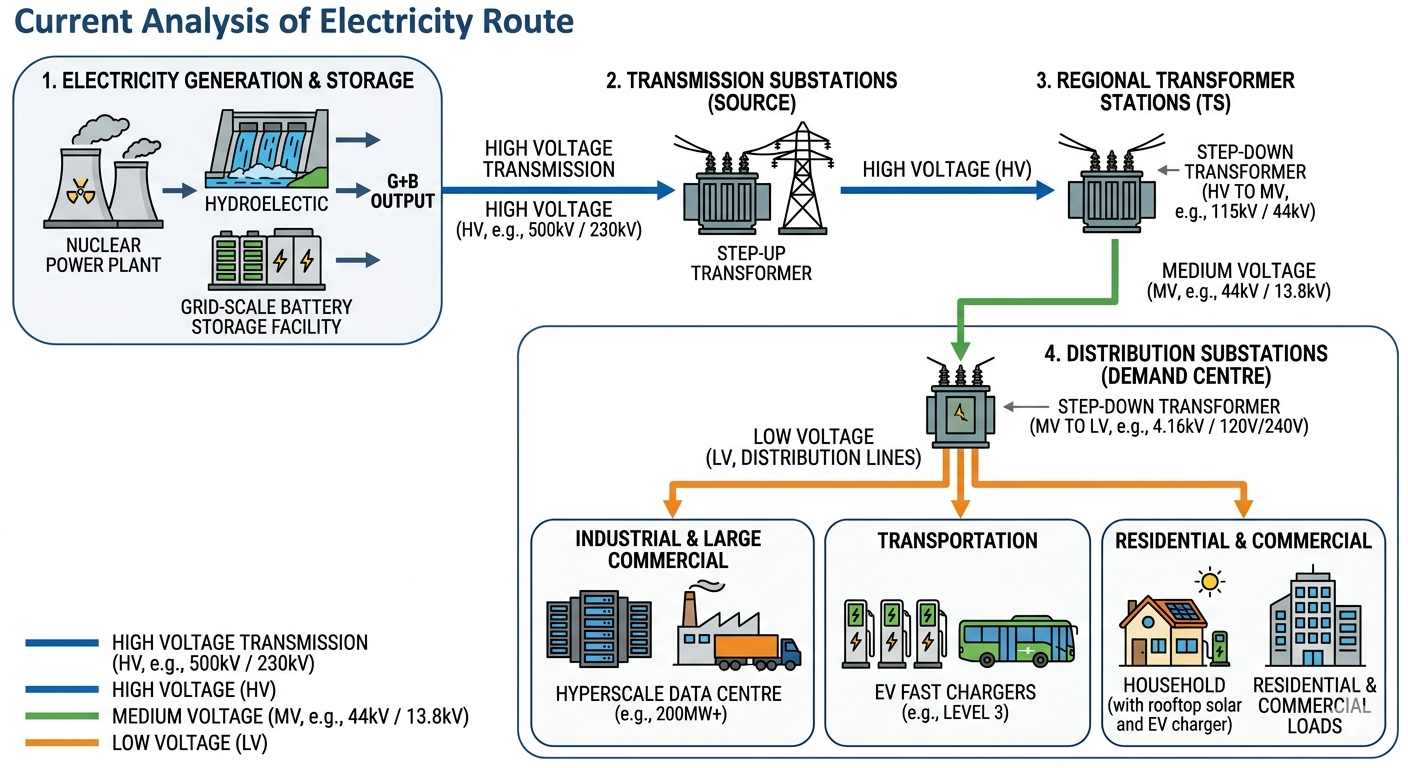
Figure 2 - Distribution Schematic
🧭 IESO Large Step Loads Schematic
Reference: IESO Demand & Conservation Planning Technical Paper - Large Step Loads (July 2025), Figure 3.
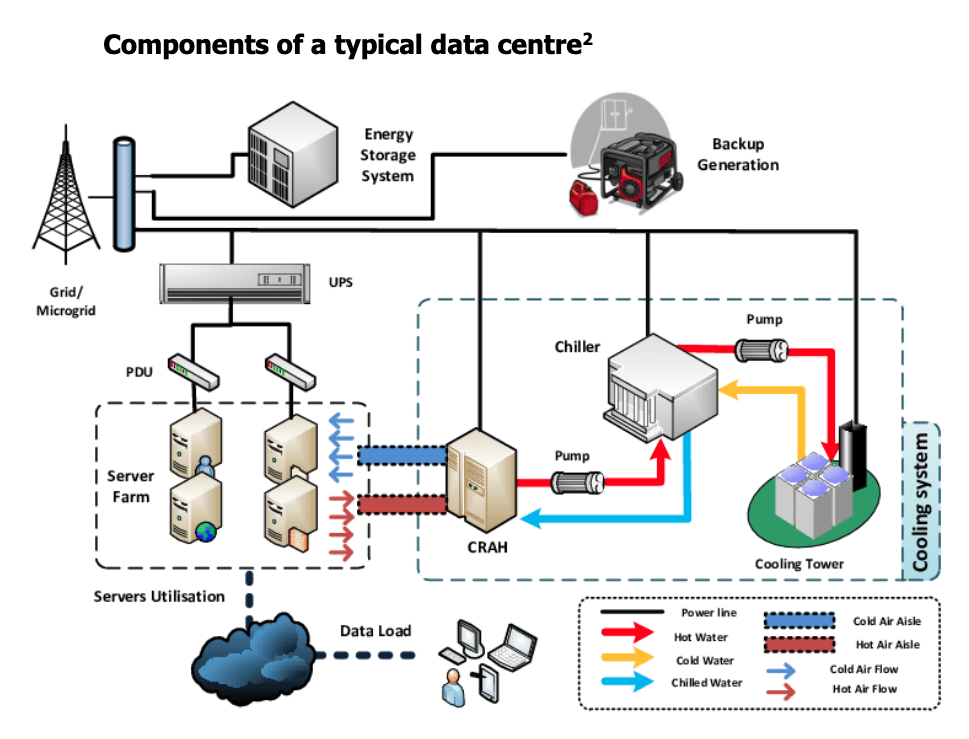
Cooling Reference
Cooling Efficiency Model
Model: Non-Linear Evaporative Cooling with an 8% Fixed Cooling Floor.
| Ambient Temperature Range | Estimated Savings | Cooling Operation Mode |
|---|---|---|
| 10 to 20°C | 10% | Evaporative Support |
| 0 to 10°C | 30% | Partial Free Cooling |
| -10 to 0°C | 50% | Full Free Cooling |
| -20 to -10°C | 70% | Peak Efficiency |