For Grid Planners, Data Centre Developers & Consultants
Screen Ontario substations
for new large loads
Ontario Grid Twin combines IESO-published station load forecasts with a Monte Carlo headroom simulation. Pick a transformer station, add a proposed data centre load, and see how often the simulated load stays within the station rating. It gives planning context; it is not a substitute for a utility connection impact study.
Stations Modelled
69stations
Published Station Loads
34of 69
Proposed Load Range
0–600MW
Monte Carlo Trials per Run
1,000–10,000
What It Does
Three things the tool does
Screen a proposed load at a station
Pick a modelled transformer station and set a step load. A capacity check and a Monte Carlo run show headroom against the station rating, which you enter where it is not published.
See a distribution, not one number
The Monte Carlo run reports the share of trials within the rating and a histogram of simulated load, with its assumptions stated next to the result.
Make grid constraints visible
The map shows each modelled station with its IESO-published load and, where a rating is available, its load factor.
Who It's For
Four kinds of user
Grid Planners & Utility Engineers
A quick first look at station headroom before a detailed study. Planning context, not a substitute for a utility impact study.
Data Centre Operators & Developers
Early screening of candidate areas: see which stations already carry the most forecast load before talking to the utility.
Grid Consultants & Planning Firms
A transparent starting point for client discussions: each station load cites its IESO table, and each assumption is stated.
Regulators & Policy Makers
Context on how proposed data centre loads compare with forecast station loads in the Greater Toronto Area planning regions.
How It Works
Public data, stated assumptions
INPUT: Select a substation and propose a data centre load
You pick a transformer station and a step load (0–600 MW).
RUN: Simulate the station load
The Monte Carlo engine runs 1,000–10,000 trials: the IESO-published station peak, an assumed triangular spread below it, plus your proposed load.
OUTPUT: See headroom with its assumptions
Simulated reliability (share of trials within the rating), a load histogram and a deterministic capacity check, each labelled with its basis.
Station loads come from IESO-published forecast tables — the simulation's assumptions are listed under Methodology below.
Platform
Analysis Modules
GRID CENTRES
Transmission Grid Hub
Map Ontario's modelled substations, flag regional constraints above a loading threshold, and drill into any node for capacity checks and Monte Carlo reliability.
DATA CENTRES
Proposed Data Centre Capacity
Ontario's proposed data centre capacity as reported by cited public sources, with the source and date for each figure.
Methodology
Modelling Approach
Station Load Basis
Each station's base load is its IESO-published 2026 peak forecast, an extreme-weather forecast. Station ratings are not published; enter one to run the analysis.
Monte Carlo Reliability
A Monte Carlo run of 1,000–10,000 trials samples ambient load from an assumed triangular distribution (0.40–1.00 × peak, mode 0.70) and adds the proposed load as a fixed step, giving the share of trials within the rating.
Deterministic Capacity Check
Peak load × an optional margin (default 1.00×) plus the proposed load, compared with the rating. The default adds no margin because the IESO tables are already extreme-weather peaks.
Technical Pipeline
01Data Sources & Registry
Station Loads
Per-station 2026 peak load forecasts are copied from IESO regional planning tables where IESO publishes them, with the source page recorded for each station.
Ontario Demand
The header shows Ontario demand from the IESO Realtime Totals Report with its report time, and is marked stale or unavailable when the report is out of date or unreachable.
02Probabilistic Reliability Modelling
Stochastic Sampling
Ambient station load is sampled from an assumed triangular distribution (0.40–1.00 × peak, mode 0.70), not fitted to station data. The proposed load is added as a fixed step.
Trials
Each run uses 1,000–10,000 trials (default 5,000). Reliability is the share of trials in which the total load stays within the station rating.
03Spatial Analytics & Visualization
Station Map
Stations are placed at OpenStreetMap substation coordinates, each cross-checked. Stations without a confirmed location are listed but not mapped.
Station Types & Regions
Hydro One transformer stations (TS) and municipal stations (MTS) across the GTA North, GTA West, Toronto planning regions.
04Assumptions & Limits
No External Benchmark Yet
Simulation outputs have not been compared with an external benchmark. Treat results as screening context, not a substitute for a utility connection impact study.
Station Ratings
Hydro One station ratings are not republished. Stations show as Unrated, and you can enter a rating for the analysis.
Data Sources
Primary Data
Generated from the project's source registry: only sources the code uses are listed.
| Source | Used for | Tier |
|---|---|---|
| Realtime Totals Report (PUB_RealtimeTotals.xml)IESOIESO Published | Ontario demand in the site header, with its report time | IESO Published |
| York Region: Integrated Regional Resource Plan - AppendicesIESOIESO Published | Peak load forecasts for GTA North stations (Table B-2) | IESO Published |
| GTA West IRRP AppendixIESOIESO Published | Peak load forecasts for GTA West stations (Table 4) | IESO Published |
| Toronto Integrated Regional Resource PlanIESOSourced Reference | Names of the Toronto stations; it has no per-station load table, so Toronto loads are not shown | Sourced Reference |
| Realtime Totals Report stylesheet (RealtimeTotals_HTML_t1-1.xsl)IESOSourced Reference | Field definitions and time zone of the Realtime Totals Report | Sourced Reference |
| OpenStreetMap power=substation features (via Overpass API)OpenStreetMap contributorsSourced Reference | Station map locations, each matched by name | Sourced Reference |
| Demand & Conservation Planning Technical Paper: Large Step LoadsIESOSourced Reference | Figure 3 (planning schematic) under References | Sourced Reference |
| One data centre or one million homes? Mapping Ontario's proposed hyperscaler boomCanada's National ObserverSourced Reference | Aggregate proposed data-centre capacity on the Data Centres page | Sourced Reference |
Copyright © 2004-2022 Independent Electricity System Operator, all rights reserved. This information is subject to the Terms of Use set out in the IESO’s website ( www.ieso.ca ).
References
Schematics & Source Documents
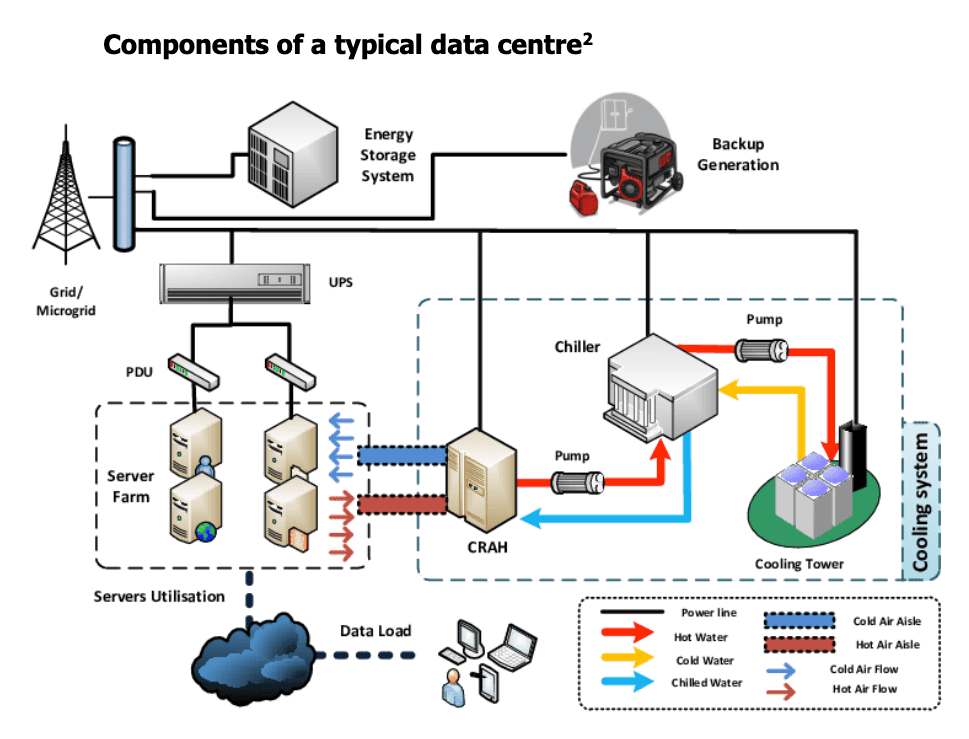
Figure 1: IESO Demand & Conservation Planning Technical Paper — Large Step Loads (July 2025). IESO PDF
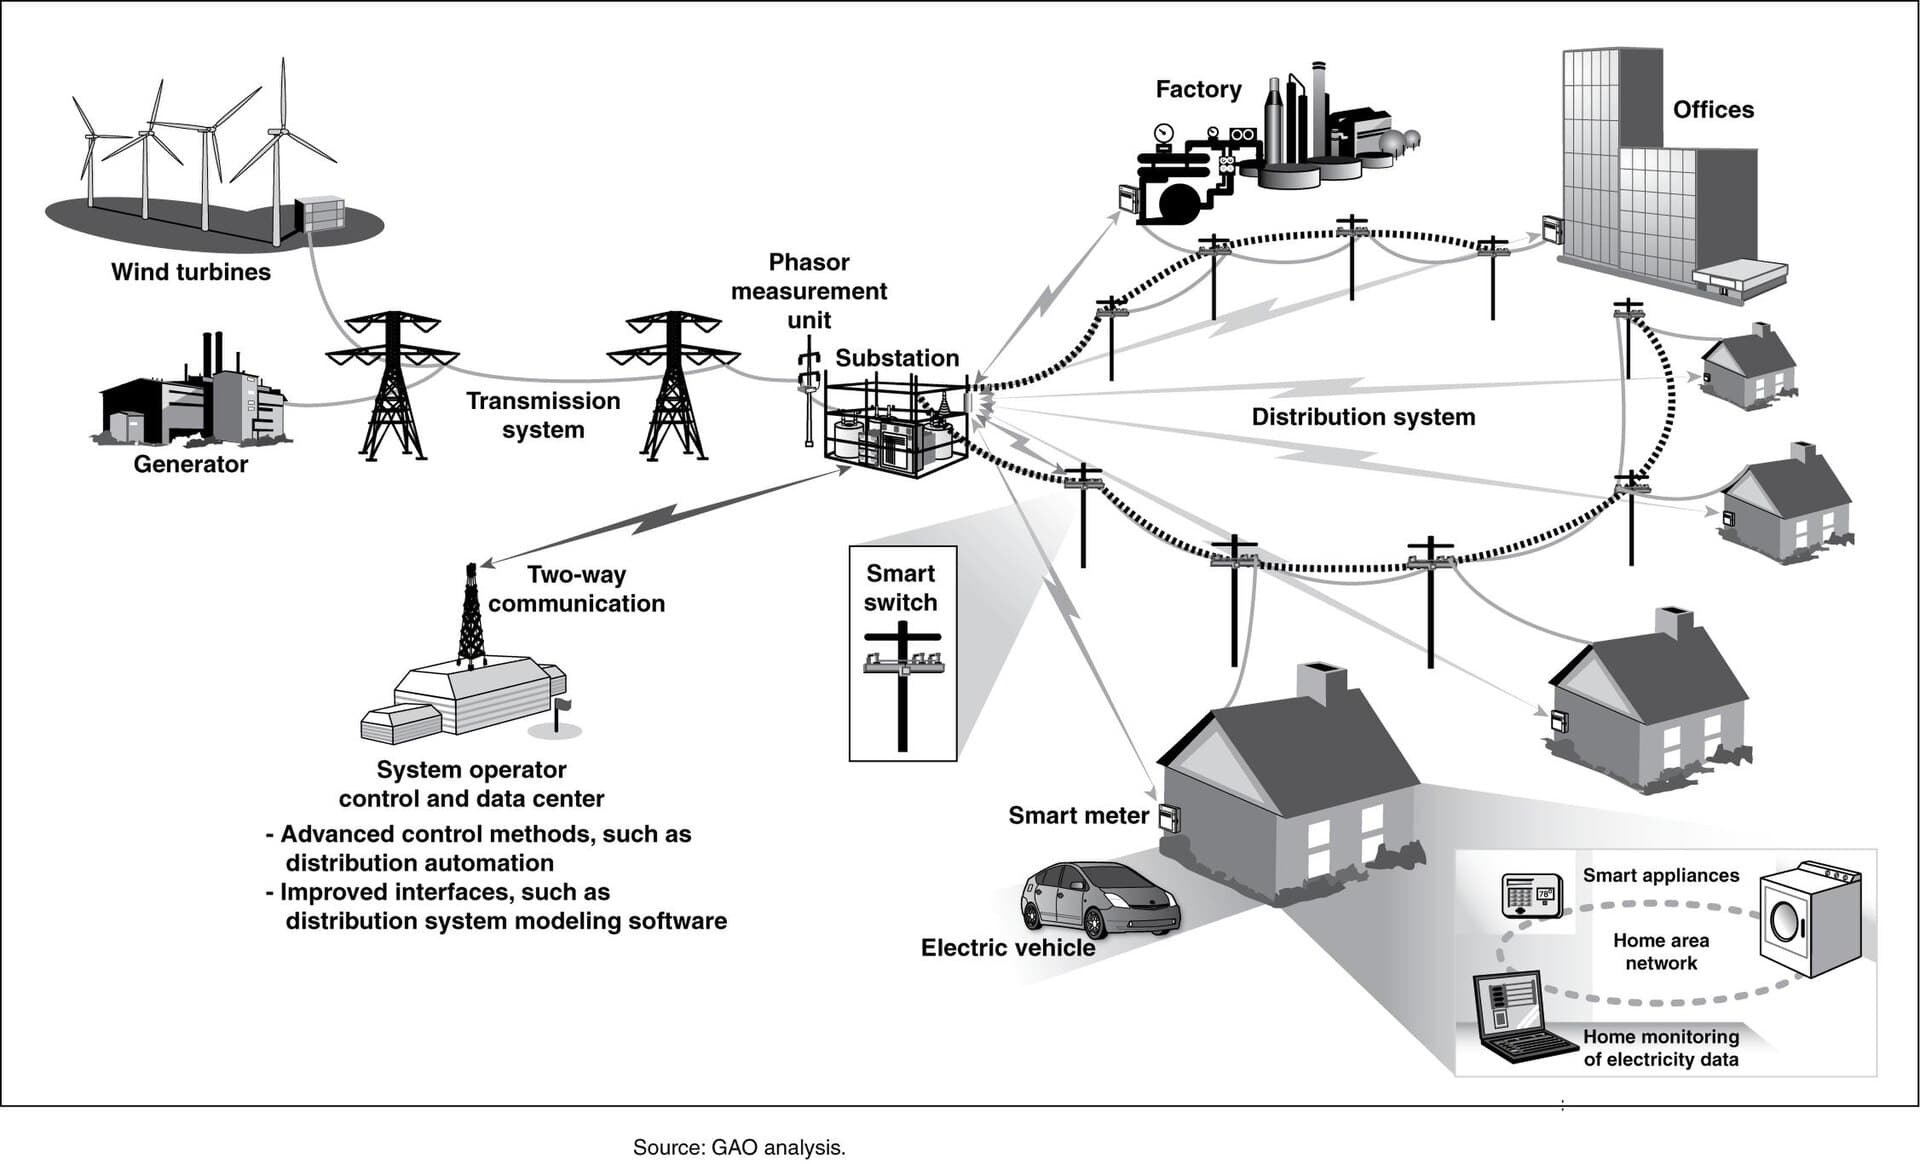
Figure 2: U.S. Government Accountability Office (GAO), “Common Smart Grid Components”, originally posted to Flickr on 7 January 2011 and reviewed on 2 September 2018 by FlickreviewR 2 as a United States Government Work (Public Domain). Source · Archive